Global disruptions in sea freight have revealed the strengths and weaknesses in supply chains. To remain dynamic in an ever-changing landscape, data has become invaluable. It allows for effective planning and quick action when markets begin to change. The seaexplorer disruption indicator is an extension of the visibility that the seaexplorer platform provides on global sea freight disruptions. It offers insights as well as advanced analytics and trends on the current situation impacting global trade.
How the disruption indicator works
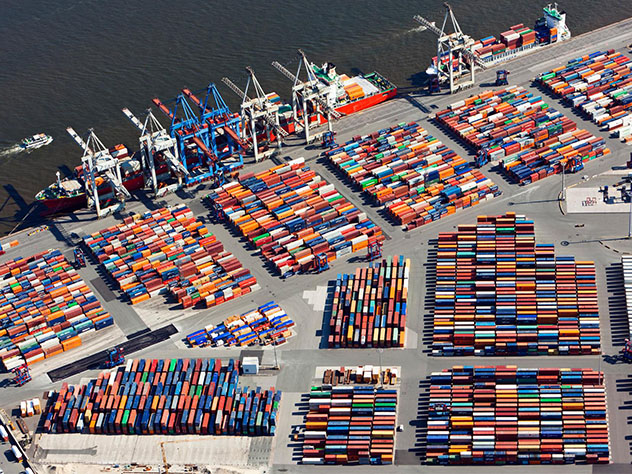
The indicator shows the cumulative TEU (Twenty-foot equivalent unit) waiting time in days at major ports including Prince Rupert, Vancouver/Seattle, Oakland, Los Angeles/Long Beach, New York, Savannah, Charleston, Hong Kong/Yantian, Shanghai/Ningbo as well as Rotterdam/Antwerp.
This example demonstrates how the indicator is determined: one vessel with 10,000 TEU capacity waiting 12 days to enter a port equals 120,000 TEU waiting days. In addition, another vessel with 5,000 TEU waiting 10 days to enter the same port equals 50,000 TEU waiting days. The total TEU waiting time is 170,000 TEU waiting days.
As a registered customer you automatically have access to the seaexplorer disruption indicator via the seaexplorer app which can be found in the Google Play Store and App Store.
White paper for more insights
We are also excited to share the new white paper on the seaexplorer disruption indicator. It takes an in-depth look at the current situation in hot spot ports, and how the trendline helps to plan for likely future impacts on supply chains and identify the best course of action.
Get your free copy today.